Building Excel Dashboards
Description
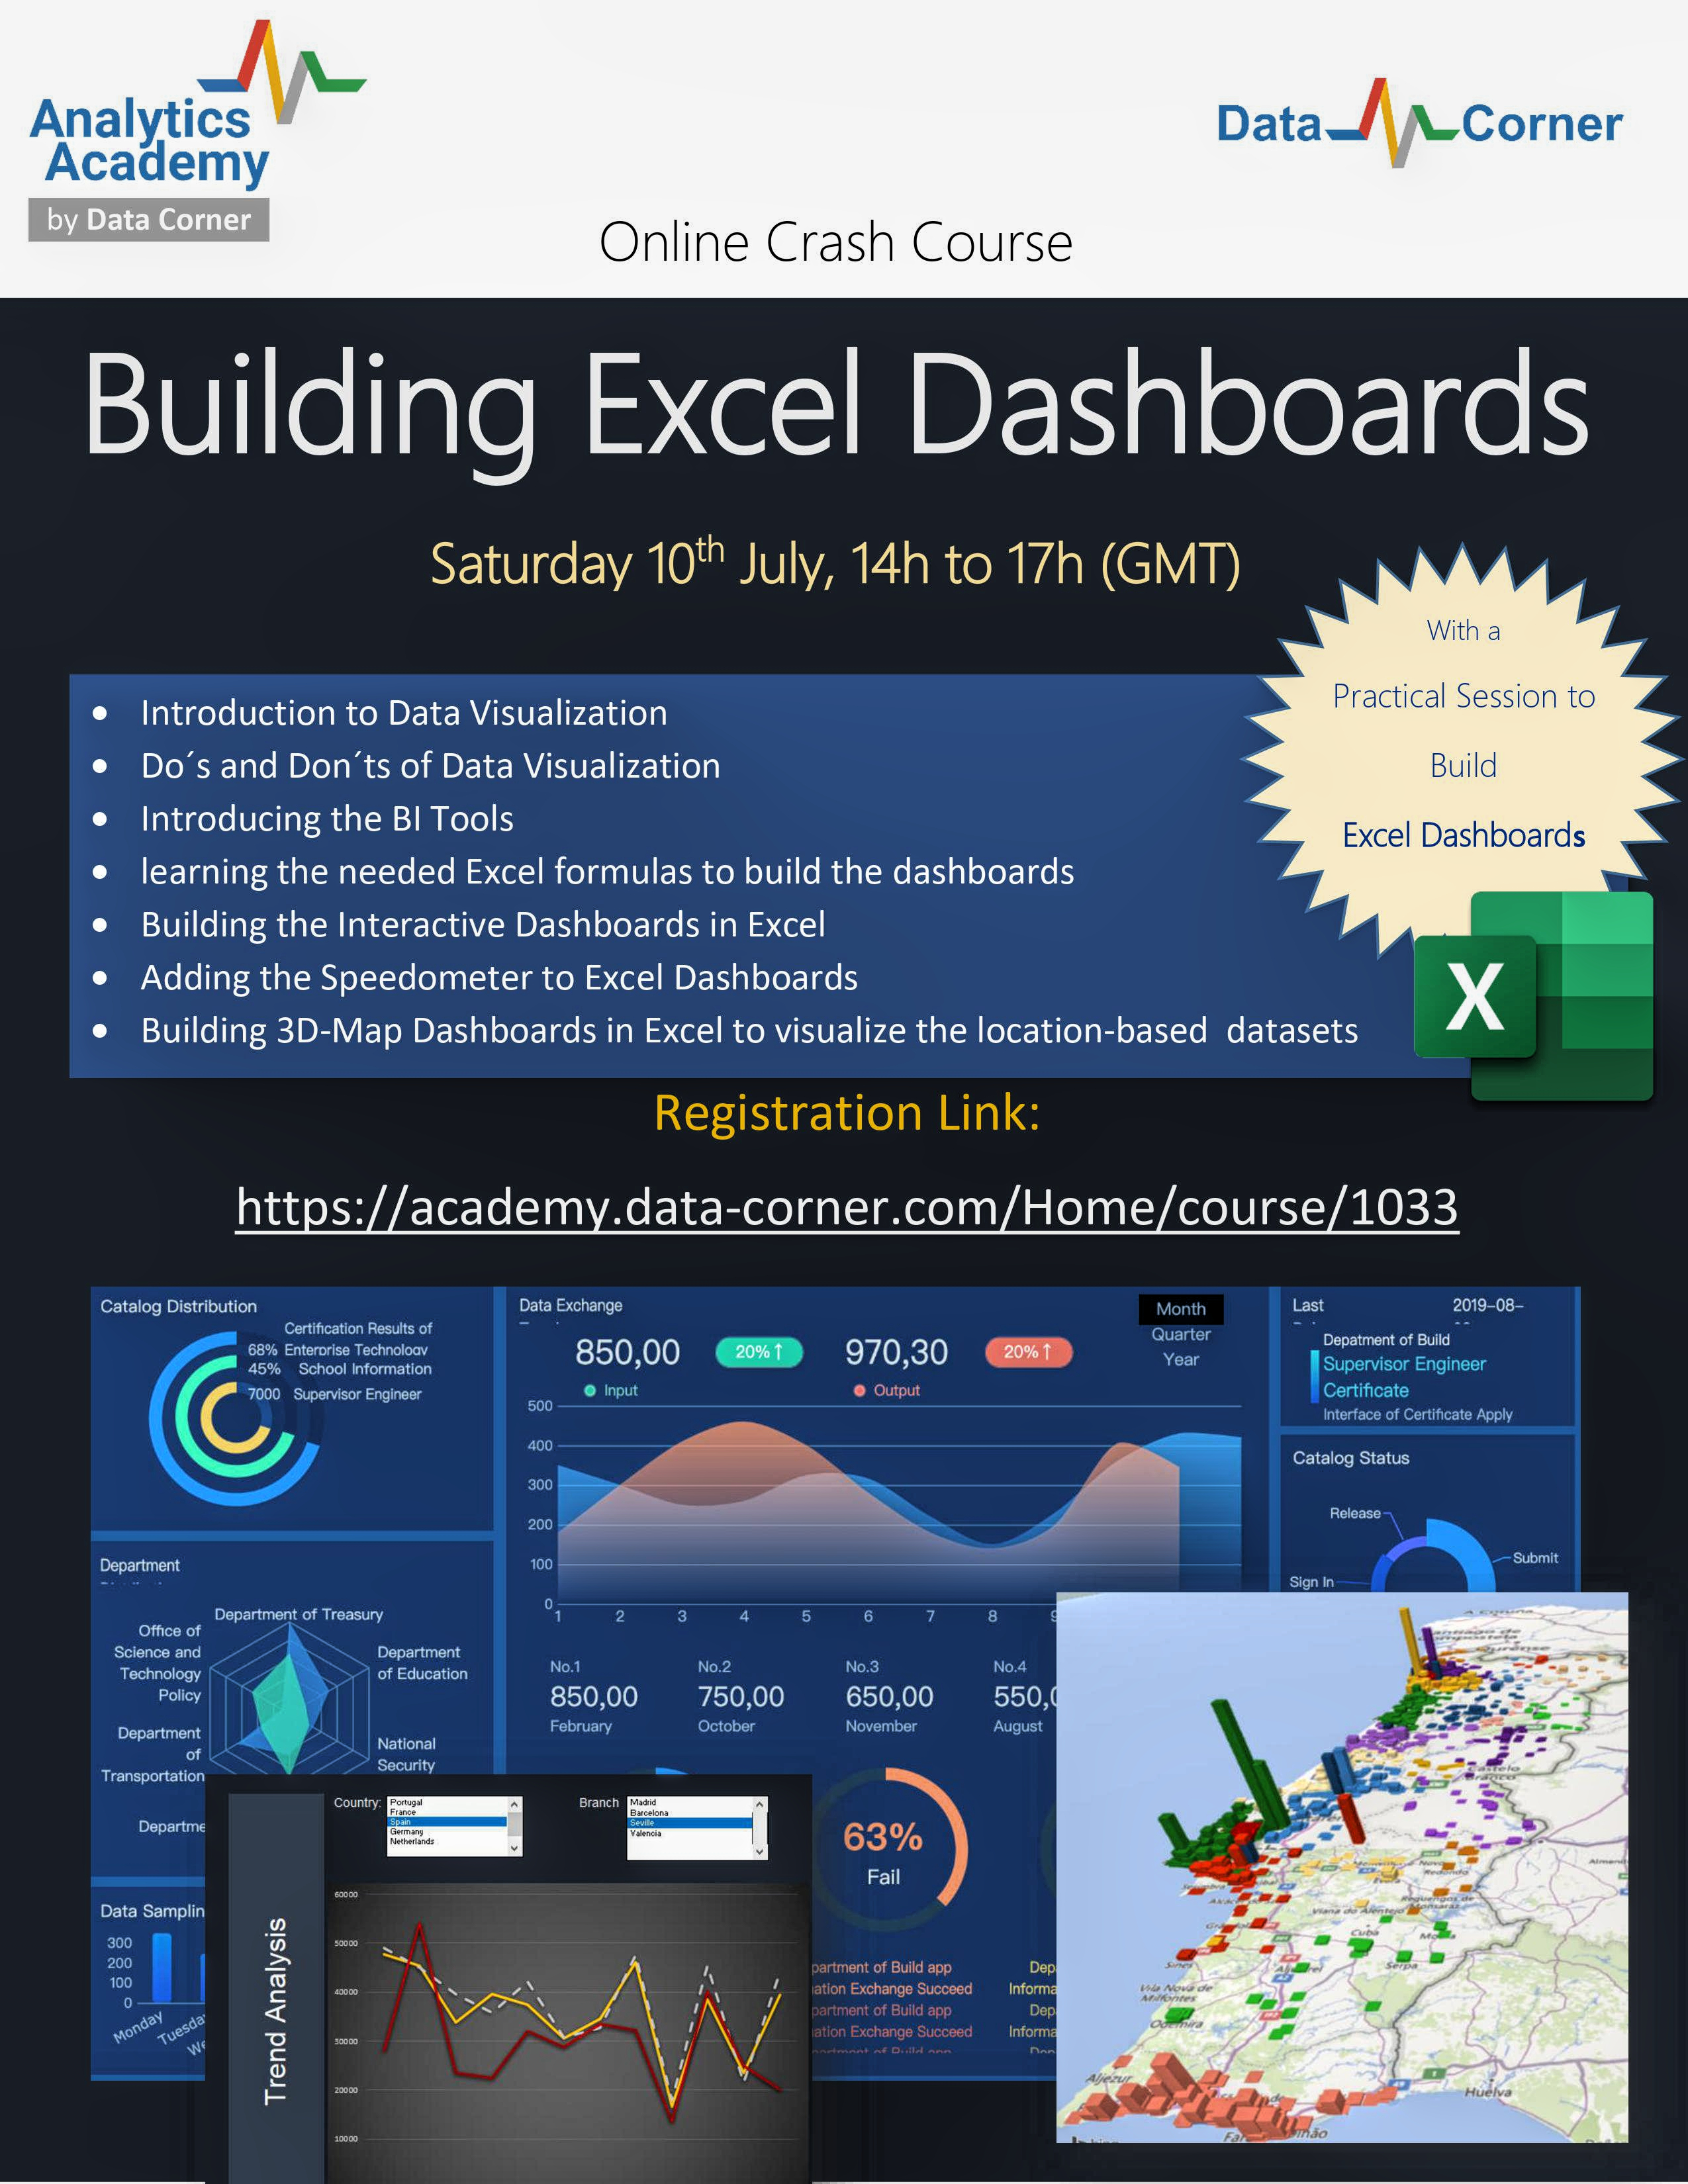
This is a practical online workshop to learn how to build Excel dashboards.
COURSE OBJECTIVES
- Learning the Do´s and Don´ts Data Visualization
- Learning how to set up and design an excel dashboard
- Learning and practicing how to build excel dashboards
- Learning and practicing how to visualize the location-based data and build the 3d-map dashboards in Excel
COURSE SYLLABUS
In this online crash course, we explore the Excel features in building interactive analytics dashboards. Aligned with the high priority of Digital Transformation, we learn how to use Excel in gaining actionable insights from the existing data in our organization.
What you will learn:
• Introduction to Data Visualization
• Do´s and Don´ts of Data Visualization
• Introducing the BI Tools
• learning the needed Excel formulas to build the dashboards
• Building the Interactive Dashboards in Excel
• Adding the Speedometer to Excel Dashboards
• Building 3D-Map Dashboards in Excel to visualize the location-based datasets
Registration fee :
€ 48
Target audience
- Managers
- Directors
- Accountants
- Students
- Marketing Staff
- Administrative Staff
- And,
- Anyone who is interested to gain more insights from their excel datasheets
.jpg)
Requirements
- Excel Basics