What do the Data Scientists need to know about Math and Statistics?
Description
As Josh Wills once said,
“Data Scientist is a person who is better at statistics than any programmer and better at programming than any statistician.”
Math and Statistics for Data Science are essential because these disciples form the basic foundation of all the Machine Learning Algorithms. In fact, Mathematics is behind everything around us, from shapes, patterns and colors, to the count of petals in a flower. Mathematics is embedded in each and every aspect of our lives.
Although having a good understanding of programming languages, Machine Learning algorithms and following a data-driven approach is necessary to become a Data Scientist, Data Science isn’t all about these fields. In this blog post, you will understand the importance of Math and Statistics for Data Science and how they can be used to build Machine Learning models.
Introduction To Statistics
To become a successful Data Scientist you must know your basics. Math and Stats are the building blocks of Machine Learning algorithms. It is important to know the techniques behind various Machine Learning algorithms in order to know how and when to use them. Now the question arises, what exactly is Statistics?
Statistics is a Mathematical Science pertaining to data collection, analysis, interpretation and presentation.
Probability Distribution
A Uniform distribution has a single value that occurs in a particular range while anything outside the range is just 0. We can assume it as a representation of categorical variables either 0 or 1. The categorical variable might have multiple values but we can visualize the same as a piecewise function of multiple uniform distributions.
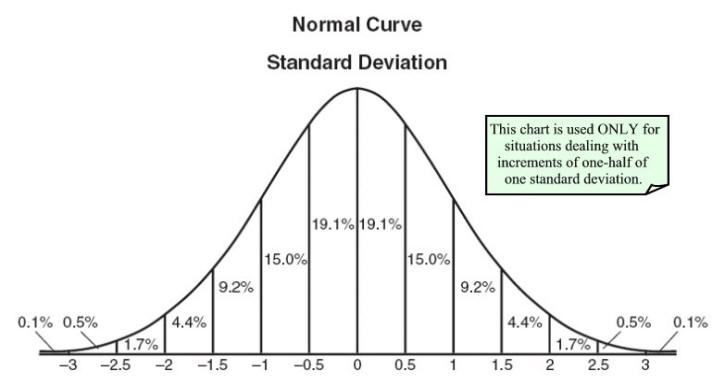
A Normal Distribution is also known as Gaussian Distribution that is defined by its mean and standard deviation. The mean shifts distribution spatially where standard deviation controls the spread. We know the average value of our dataset and the spread of the data with Gaussian distribution.
A Poisson Distribution is the same as Normal but with the addition of skewness. It has a relatively uniform spread in all directions just like normal at the time of low-value skewness. The spread of data will be different in different directions when the skewness value is high.
There are many distributions you can know which help to interpret our categorical data with Uniform distribution. Many algorithms perform well with Gaussian. In Poisson, we have to take extra care and choose a robust algorithm.
Probability distributions helped calculate confidence intervals for parameters and critical regions for the hypothesis tests. For univariate data, it is useful to determine a reasonable distributional model for the data. Statistical intervals and hypothesis tests depended on specific distributional assumptions.
Over and Under Sampling
Classification problems use these techniques. Sometimes, our classification dataset is biased towards one side. For example, we have 1000 samples for class 1, but only 200 for class 2. We have ML techniques to model the data and make predictions. In this case, we have two preprocessing options that help in the training of our ML models.
Under-sampling means we select only some data from the majority class, as the same number of the minority classes. Now we have a balance on the probability distribution of the classes. The dataset is level out by choosing fewer samples.
Oversampling means we multiply the minority class such that it has the same count as the majority class. Now we have leveled out our dataset and the distribution of minorities without additional data.
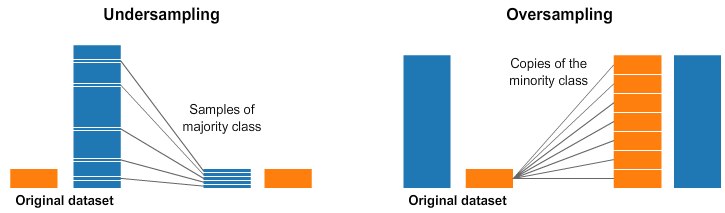
In the above-mentioned example, we can solve the issue in two ways. By using undersampling we select only 200 records for both the class 1 and 2. Another method is using oversampling or upsampling we replicate 200 examples to 800 such that both classes have 100 examples each where the model works better.
Accuracy
True positive: whenever the predicted and the original value is the same then it is true or counted.
True negative: doesn’t recognize or identify when the condition is not true.
False-positive: whenever the condition is not present it is false or detected.
False-negative: doesn’t identify the condition when it is not present.
Sensitivity: also termed as recall; measures the proportion of actual positive cases that got predicted as positive (True positive). sensitivity = TP/(TP+FN).
Specificity: measures the proportion of actual negative cases that got predicted negative (True negative). specificity = TN/(TN+FP).
Precision: measures the proportion of both True and False positive that got predicted correctly. precision = TP/(TP+FP).
Accuracy helps to evaluate the performance of models, and in some cases, it is not an efficient metric. Precision tells how precise/accurate our model is out of that predicted positive. When the costs of false-positive are high, Precision is a good measure to determine. In email spam detection, a false positive means that a non-spam email (actual negative) had shown as spam (predicted spam). The email user might lose important emails if the Precision is not high for the spam detection model. When there are high costs associated with false-negative, Recall is the best metric to choose the model. For example, in fraud detection. If a fraudulent transaction (Actual Positive) resulted as non-fraudulent (Predicted negative), the consequence would be worse for the bank.
Hypothesis Testing and Statistical Significance
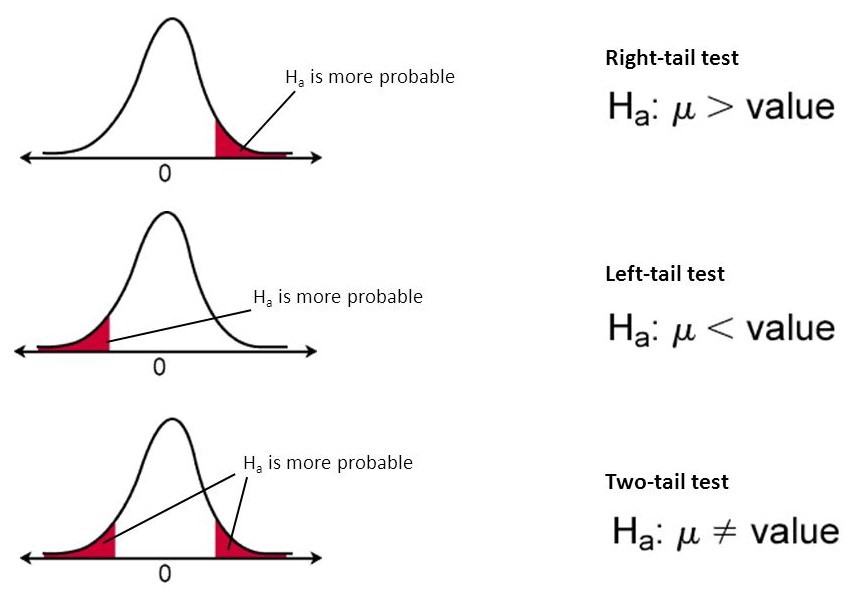
Null Hypothesis: the hypothesis that there is no difference between the specified population.
Alternative Hypothesis: The hypothesis that states something is happening to the sample observations due to an external cause.
P-value: it is the probability of obtaining the expected result of a test, assuming that the null hypothesis is true. A smaller p-value means there is stronger evidence in favor of the alternative hypothesis.
Alpha: the probability of rejecting the null hypothesis when it is true, this is also known as Type 1 error.
Beta: known as Type 2 error, failed to reject the false null hypothesis.
Out of all the statistical concepts, this is my favorite one. Hypothesis testing is an essential step in statistics. It helps to evaluate two mutually exclusive statements about a population to determine which argument is best supported by sample data. Statistical significance is a measure of the probability of the null hypothesis being true compared to the acceptable level of uncertainty regarding the correct answer. A p-value of 5% or lower is considered statistically significant. Statistical hypothesis testing helps to determine whether the result of the data set is statistically significant.
Dimensionality Reduction
It is the process of reducing the dimensions of our dataset. The purpose of this is to solve problems that arise in the case of datasets with high dimensions. In other words, it has many features. When a more dependent variable exists in a dataset, then more samples need to have every combination of features that increase the complexity of our model. Dimensionality reduction can include less data equivalent to many features that help in faster computing, fewer redundancies, and more accurate models.
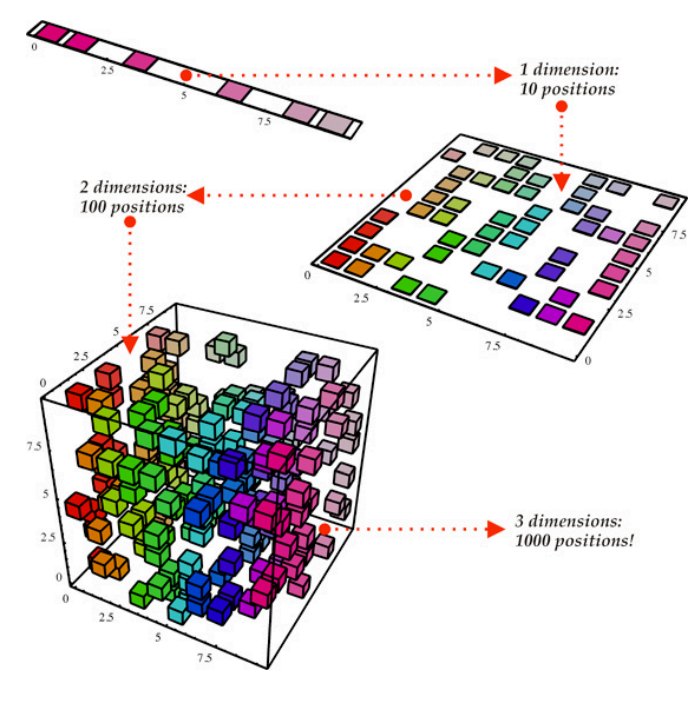
From the above representation, we consider our dataset as a cubical structure that has three dimensions and 1000 points or values. With today’s computational power and techniques, 1000 records are easy to process, but on a large scale, we may run into problems. However, when we look at our data in a 2-Dimensional view that is one side of the cube, we can conclude that it’s easy to separate all the colors from this view. The projection of 3D data onto a 2D plane is possible by Dimensionality reduction. It effectively reduces the number of values we need to compute onto a 100. When it comes to vast data the reduction would be a more computational saving that leads to good results.
Future pruning is another way we can perform dimensionality reduction. In this, we remove features that are not important to our analysis. For example, after exploring our dataset we may find out of 9 independent variables, 6 of them have a high correlation with output, but the other 3 have a very low correlation. Then removing those three features doesn’t impact our results.
PCA is one of the most common statistical concepts used for Dimensionality reduction that creates vector representation of features that impact output that is a correlation.
Conclusion
Many other statistical concepts needed to be known for those who are interested in the journey towards Data Science based on the scenario. These are like building blocks of Data science. Statistics help to solve complex problems in the real world so that Data scientists and researchers can look for meaningful trends and modifications in data. In simple words, used to derive useful insights from data by performing mathematical computations on it. Hence, my advice is to spend enough time to learn skills that would be helpful in your journey.
References:
https://www.edureka.co/blog/math-and-statistics-for-data-science/
https://www.analyticsvidhya.com/blog/2020/11/top-5-favorite-statistical-concepts/