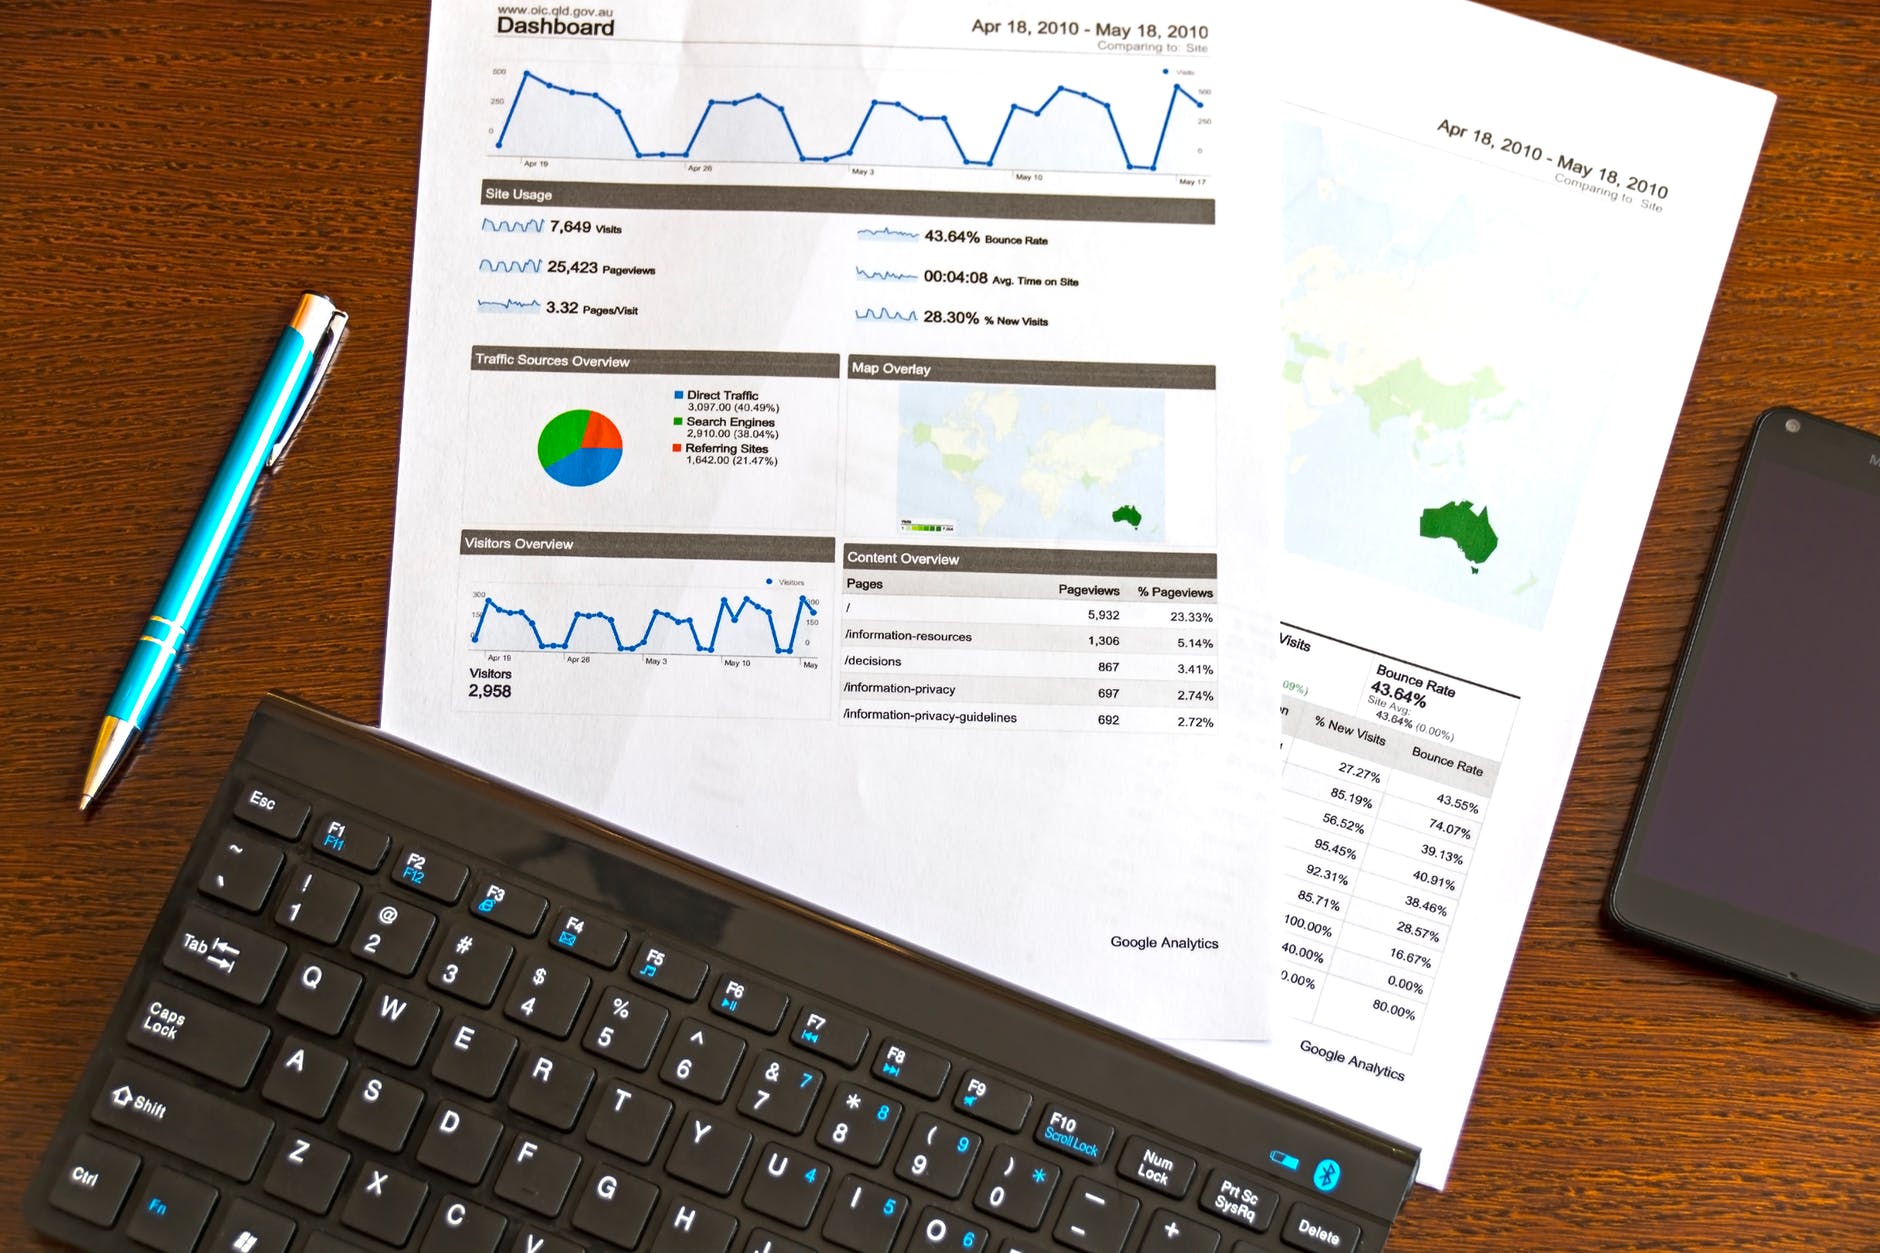
Advances of Data Analysis and Building Interactive Dashboards (using Excel)
Description
In this course you will learn the A to Z of building interactive Excel dashboards, so you and your colleagues can see trends in your own data and make data driven decitions.
Also, you will receive some
ready-to-use templates to easily build the dashboards on your own data.
COURSE OBJECTIVES
•To learn best practices for how to use data analytics to make
your company more profitable
•To learn the essential concepts on building KPI monitoring dashboards
•To understand the risk matrix
•To do data mining in excel
•To learn how to implement trend analysis and predictive dashboards
•To know how to apply excel formula toolbox
•To learn VBA programming
•To build interactive dashboard reports
•To apply what you learned in building an interactive dashboard on a real data
COURSE SYLLABUS
•Data Analysis key concepts and techniques
•Data cleaning methods in Excel
•The key concepts of building a responsive dashboard
•Exploratory analysis techniques in Excel
•Advanced excel chart techniques
•KPI dashboards and risk matrix
•Dashboard formula toolbox
•Excel form controls
•Creating professional reports in Excel
•Trend analysis and predictive modeling in Excel
•VBA programming
•Scrolling table and bars
•Dynamic headers
•Final project to build a responsive dashboard on your own data
